In Part 4 of our series on Global Warming and Climate Action we will be examining future greenhouse gas emissions scenarios and their impact on the global climate. Most materials discussed here are contained in the 2021 report of the Physical Science Working Group of the IPCC.
Part 4: Predicted Climate Impacts
The 2021 Physical Science Report of the IPCC presents the predicted temperature impacts of five “illustrative scenarios” of future anthropogenic greenhouse gas emissions based on different socio-economic assumptions, levels of climate change mitigation, and air pollution controls. No opinion is given on the likelihood of the scenarios.

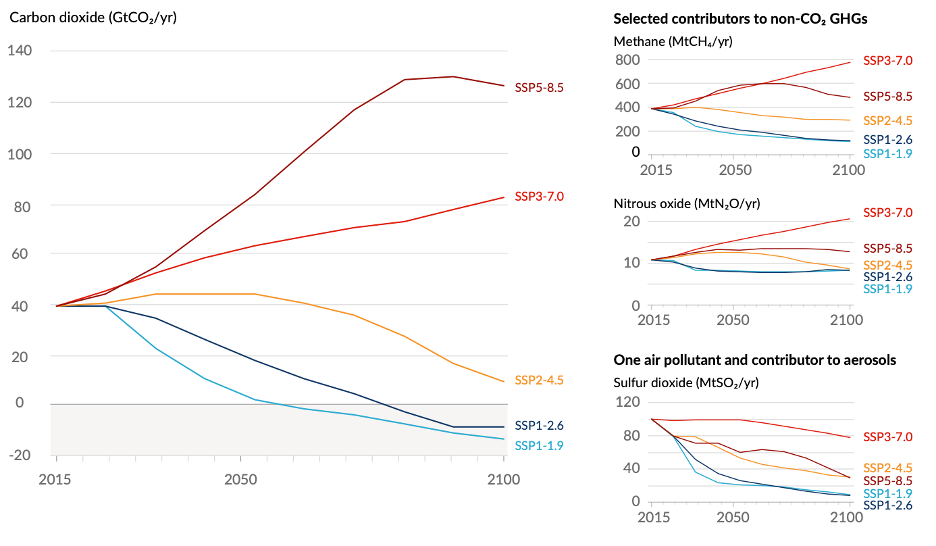
Figure 9 - Five Illustrative Emissions Scenarios (IPCC). Quoted CO2 emissions include land use change (±6 Gtpa) emissions.
SSP5-8.5 describes the “business as usual” scenario, where very little is done to curb emissions from fossil fuels and industrial processes.
On the other hand, SSP1-1.9 describes the steep emissions reduction track prompted by the 2015 Paris Agreement’s call to keep global warming well below 2 °C above the pre-industrial average and which calls for “global net-zero emissions” by 2050.
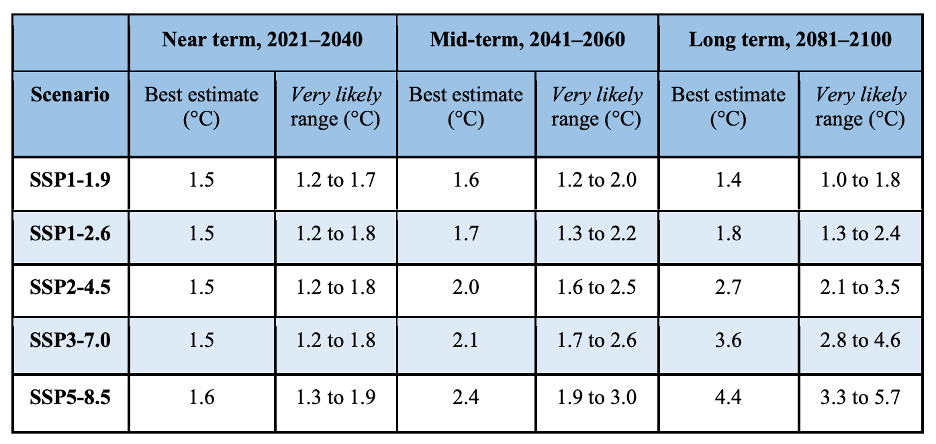
Predicted temperature increases for each scenario are shown in Figure 10.

Figure 10 - Predicted Global Average Surface Temperature vs. the 1850-1900 average (IPCC)
The report also contains predicted extreme weather events for each scenario. Unsurprisingly, with increasing greenhouse gas concentrations both the frequency and intensity of extreme weather events increases.

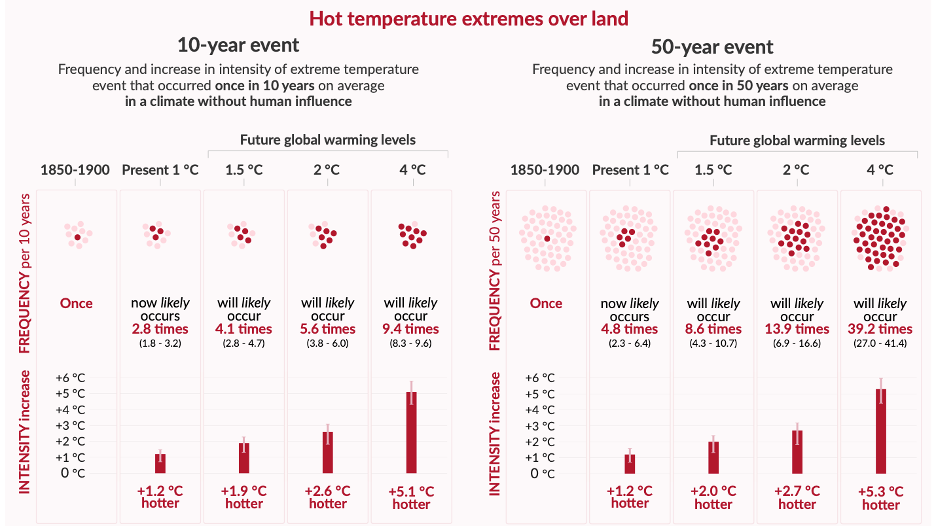
Figure 11 - Projected Changes in Hot Weather Extremes vs the 1850-1900 average (IPCC)

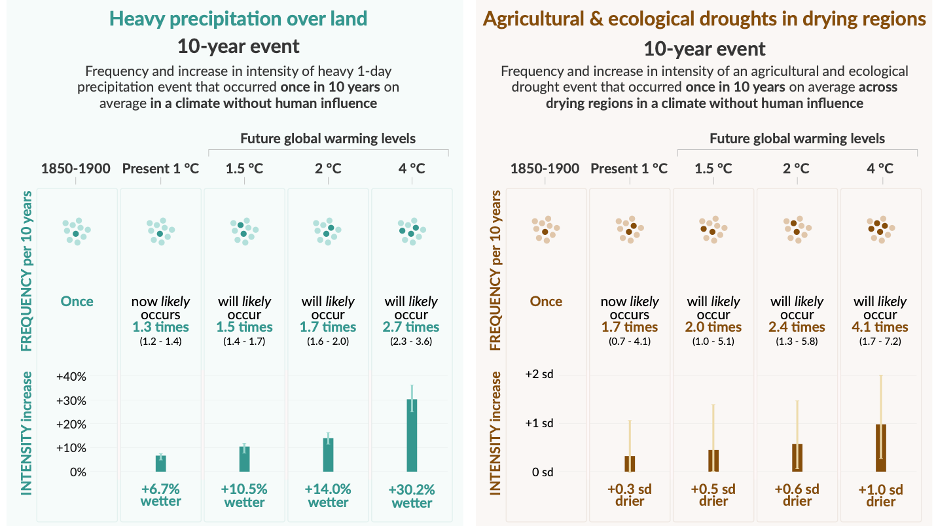
Figure 12 - Projected Changes in Precipitation Extremes vs the 1850-1900 average (IPCC)
Figure 11 and Figure 12 show that the higher the average global temperature becomes, the more frequent and intense the weather extremes will be.
In the "business as usual" scenario described by SSP5-8.5, by mid-century 4 in every 5 years will see heat waves that we now only see once every 50 years and these heat waves will be well over 5°C hotter on average.
If anything, these predictions can be considered conservative since “low likelihood / very high impact” climate events, such as an abrupt shut down of the Atlantic overturning circulation (AMOC) or destabilization of the Jet Stream, were not taken into account. These types of possible events are not well understood, and their highly non-linear nature makes it hard to model these numerically; however, hard to model or not, non-linear events have been known to occur and their potentially extreme impacts should kept in mind when evaluating the overall climate impact of anthropogenic emissions.
