In this Part, we are looking at anthropogenic greenhouse gas emissions in more detail. We will learn about the main sources of these emissions to prepare a framework in which to evaluate proposed climate actions.
Part 6: Anthropogenic Emission Sources
The Global Warming Potential of a greenhouse gas over a 100-year period (GWP100) depends on the size and position of its absorption spectrum and on how long it stays in the atmosphere.
For convenience, quantities of greenhouse gases other than CO2 are expressed in “CO2 equivalent” units (CO2e) by multiplying their mass by their GWP100 relative to that of CO2.

Figure 13 – Share and Relative Global Warming Potential for Anthropogenic Greenhouse Gases <EPA>
By this calculation, the emission of 1 ton of SF6 gas (which is used to insulate high-voltage switchgear for example) equals 22,800 tons CO2e.
The equivalent units are useful as bookkeeping tools, but they are not very precise; for example, they underestimate the short-term impact of Methane (GWP20 = 84), as well as the long-term impact of Industrial F-gases. Different sources may also quote different GWP; however, these differences are slight and remain within the same order of magnitude.
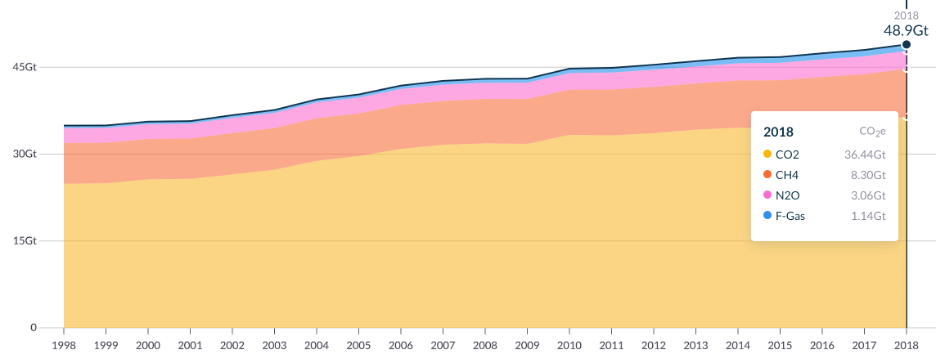
Figure 14 - Anthropogenic Emissions during 1998 - 2018 by Greenhouse Gas Type. Image credit: <Climate Watch>
In what follows, “billion tons” will be expressed as Gigatons (Gt), so “1 billion ton of CO2e” will be written as “1 GtCO2e”.
Human activities today release about 50 GtCO2e of greenhouse gases per year, including ±35 GtCO2. In the 1950s, humanity released ±6 GtCO2 per annum; therefore, since the 1950s, the world population has tripled while its CO2 emissions went up 6-fold. By comparison, the main natural mechanism for atmospheric CO2renewal, global volcanic activity, releases about 0.5 GtCO2 each year.
Figure 15 shows how the main economic sectors and activities contribute to the type and quantity of greenhouse gas emitted (as a portion of total emitted GtCO2e).
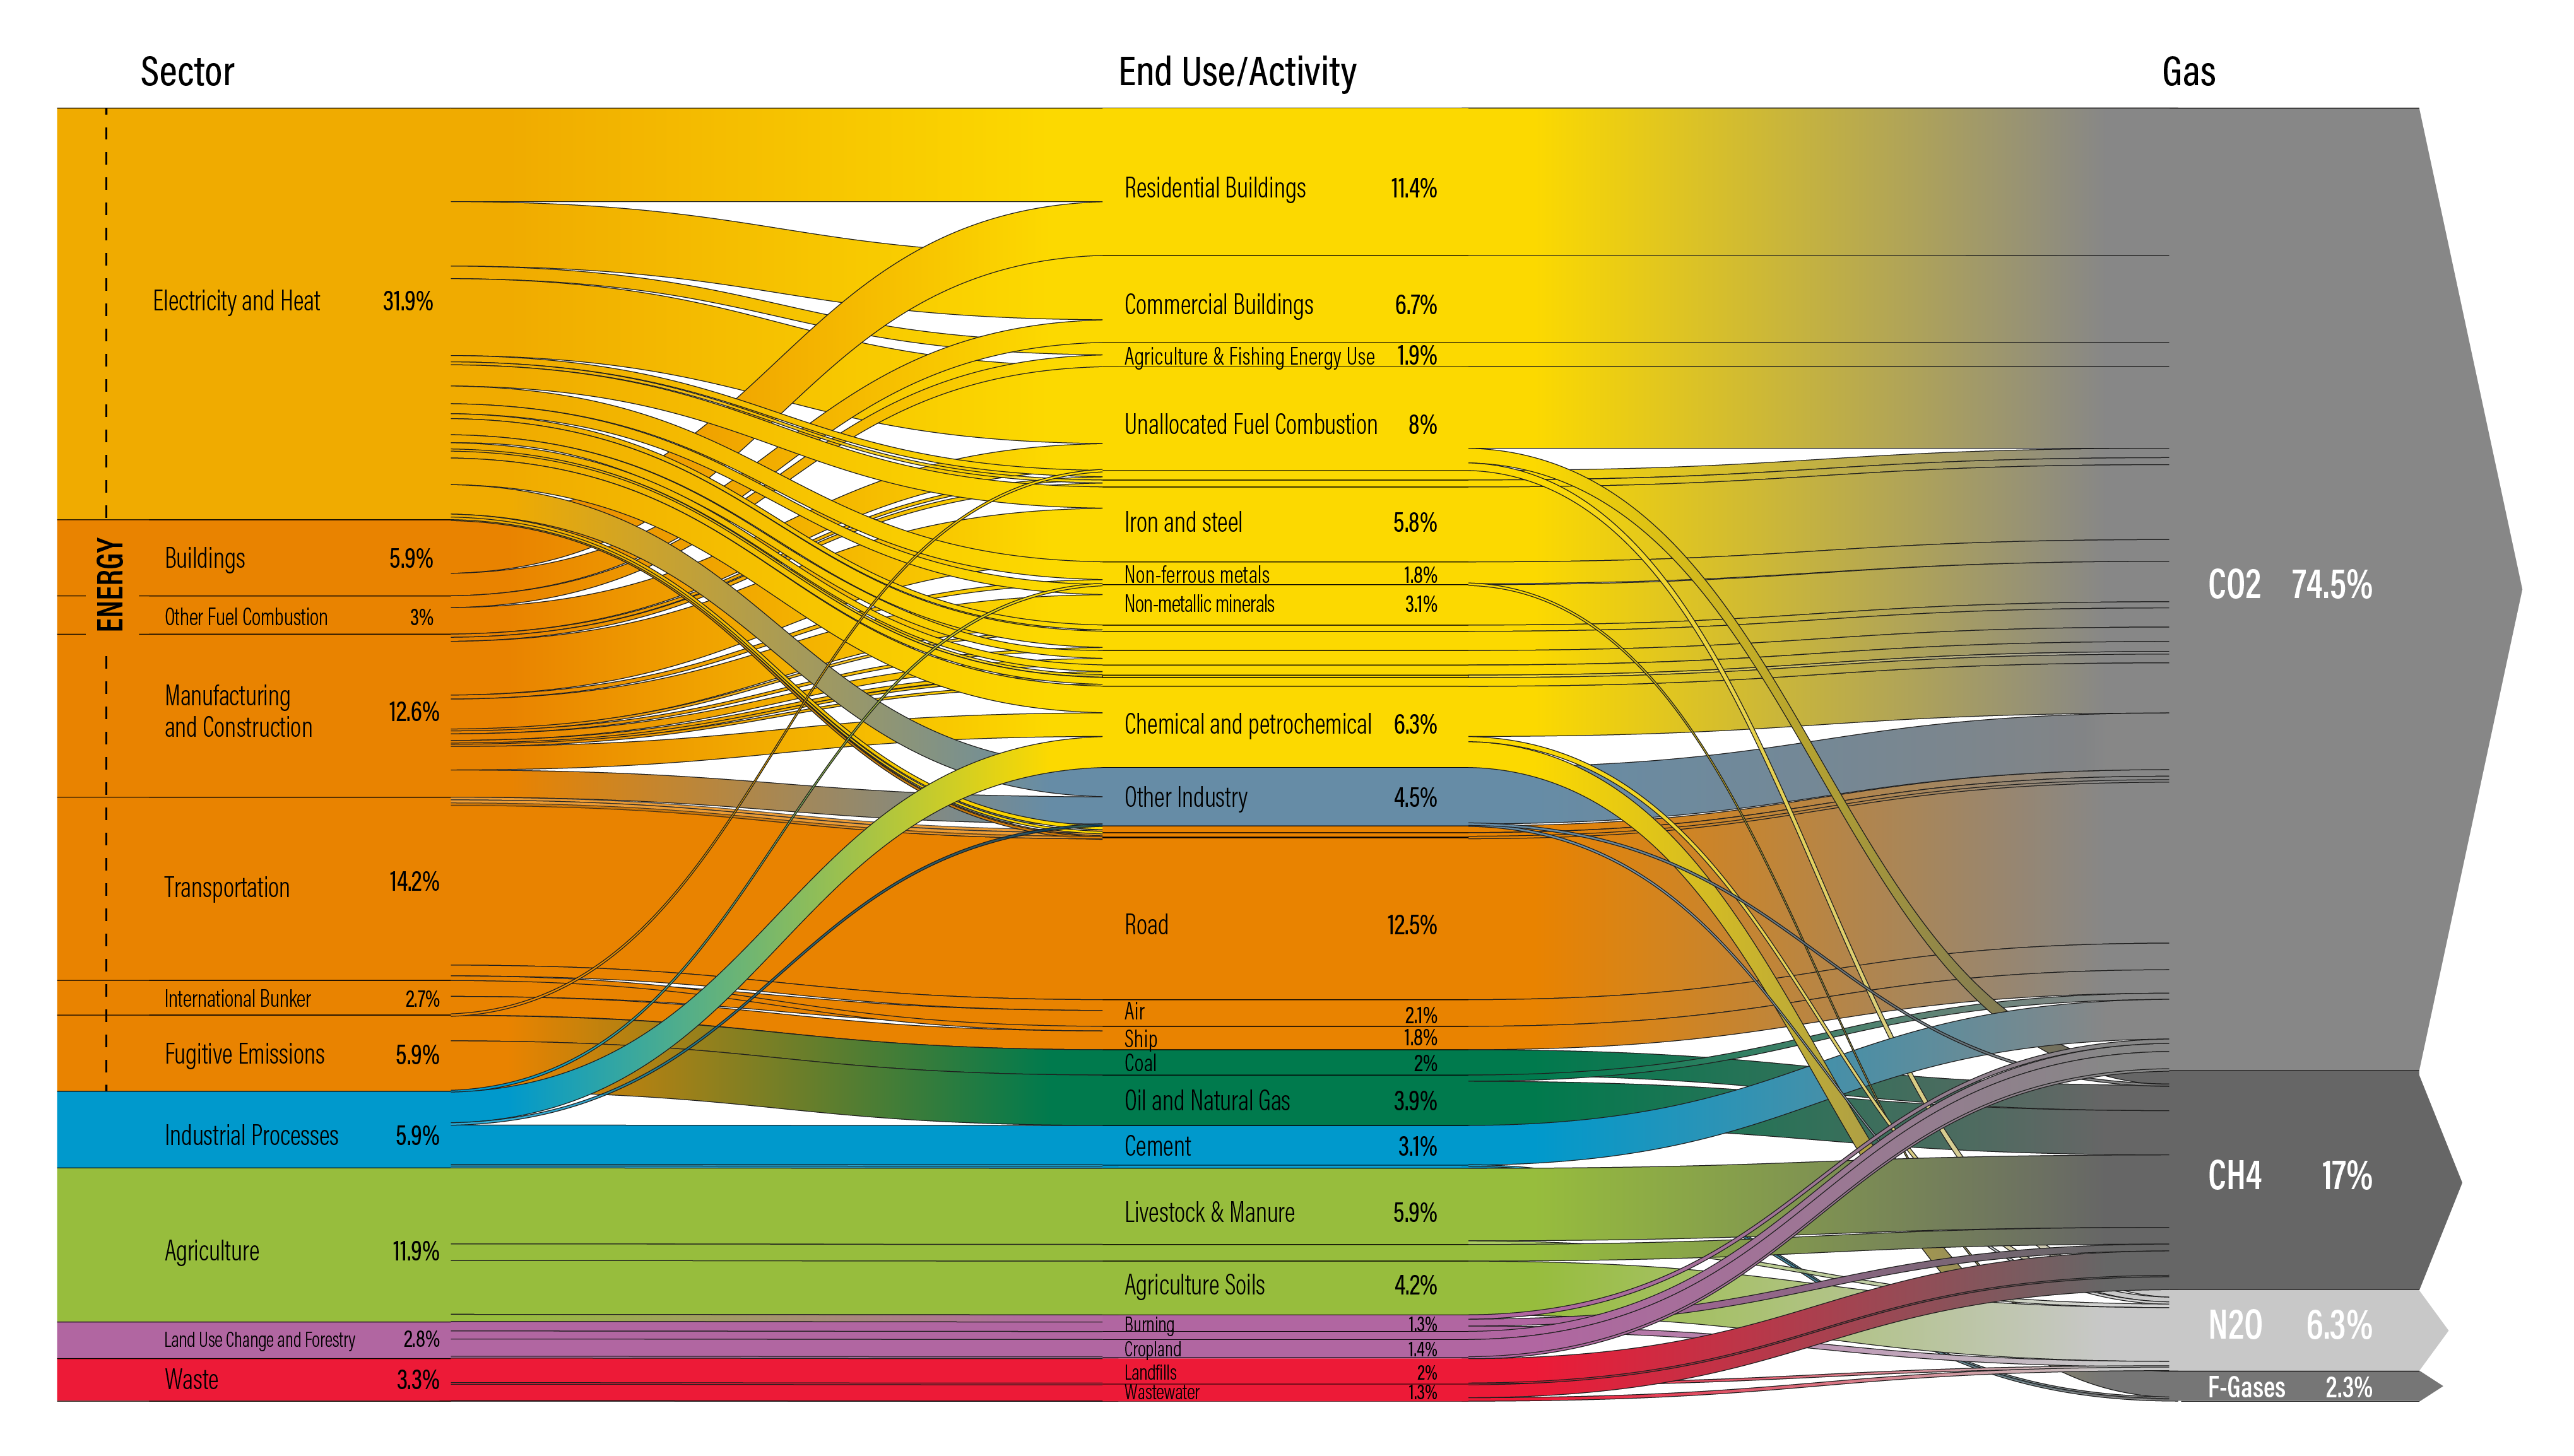
Figure 15 - Human Activity to Greenhouse Gas Emissions (2018; 48.9 GtCO2e total emissions). Image Credit: <WRI and Climate Watch>
The single largest contributor to global emissions is the Power Sector, which burns coal and gas to generate electricity. According to the IEA World Energy Outlook, in 2019 the Power Sector emitted about 13.5 GtCO2, which was ±40% of all anthropogenic CO2 emitted, or ±28% of all greenhouse gas emissions that year.
According to Carbon Brief, nearly 10 GtCO2 was emitted by coal-fired power generation plants that year, about half of which in China. As can be seen in Figure 16, this is not likely to change in the near future.

Figure 16 - Coal-fired Power Plant Capacity (Operating and Planned, 2019)
Figure 17 shows that burning coal is by far the dirtiest way to generate electric power, with median life cycle emissions of 820 grams of CO2e per kWh (gCO2e/kWh). Using gas-fired generation emits 490 gCO2e/kWh, while low-carbon electric power generation options emit well below 50 gCO2e/kWh.
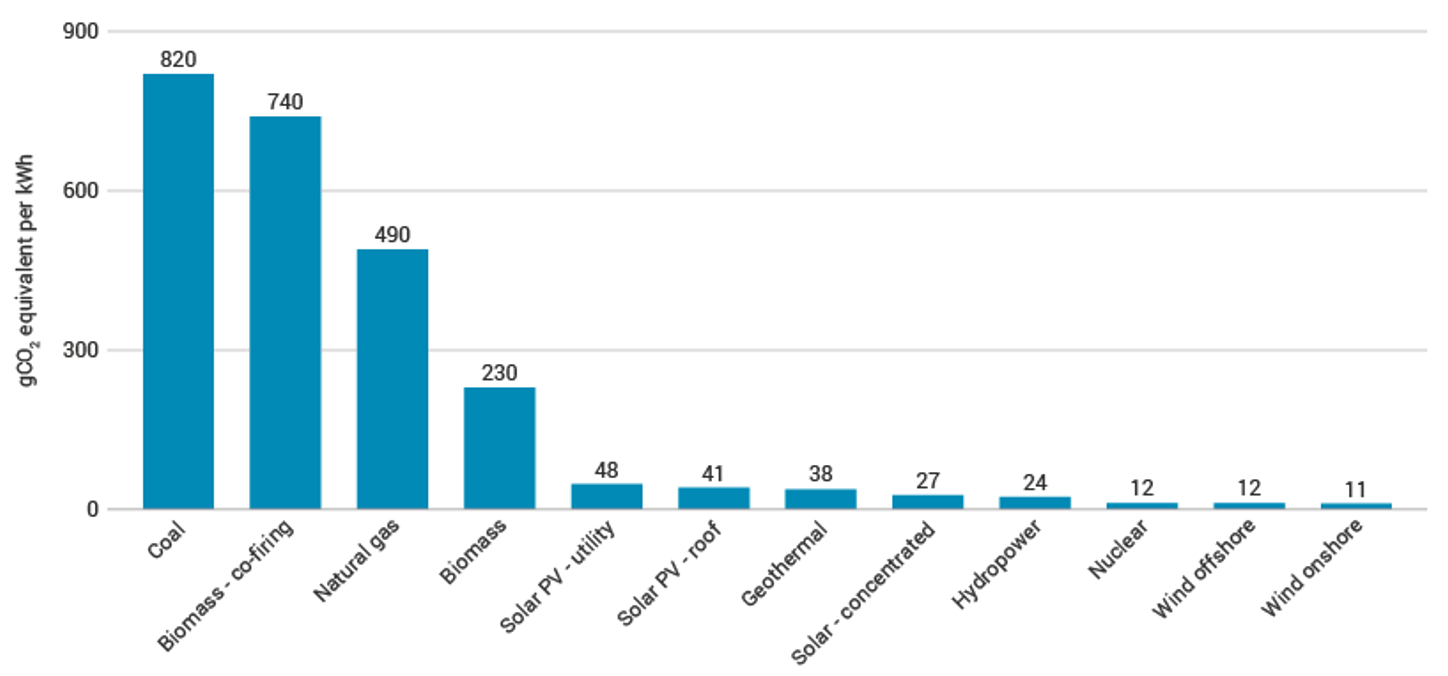
Figure 17 - Median Life-cycle Emissions Intensity of various Electric Power Generation options <IPCC, Schlomer et al., 2014>
If all coal-fired generation plants would be replaced by gas-fired generation plant, their lifecycle emissions would reduce from about 10 GtCO2 to around 6 GtCO2 per annum. When replaced by low-carbon generation, their lifecycle emissions would reduce to below 1 GtCO2 per annum.
In 1985, an estimated 9,825 TWh of electric power was generated worldwide, of which 35% by low-carbon electric power generation. In 2019, an estimated 26,900 TWh was generated, and low-carbon generation accounted for 38% of this amount. This shows that the increase of installed low-carbon generation capacity has kept up with that of fossil fuel; however, it also shows that investment in low-carbon generation capacity must be accelerated dramatically to not only keep up with the expected rise in global electricity demand, but to also replace power generation from fossil fuels, starting with coal.
The next largest contributor to global emissions is the Transport Sector, which burns refined oil products in vehicles of all kinds. In 2018, the transport sector emitted 8 GtCO2 or about 24% of all CO2 emitted that year, or 17% of total anthropogenic greenhouse gas emissions.
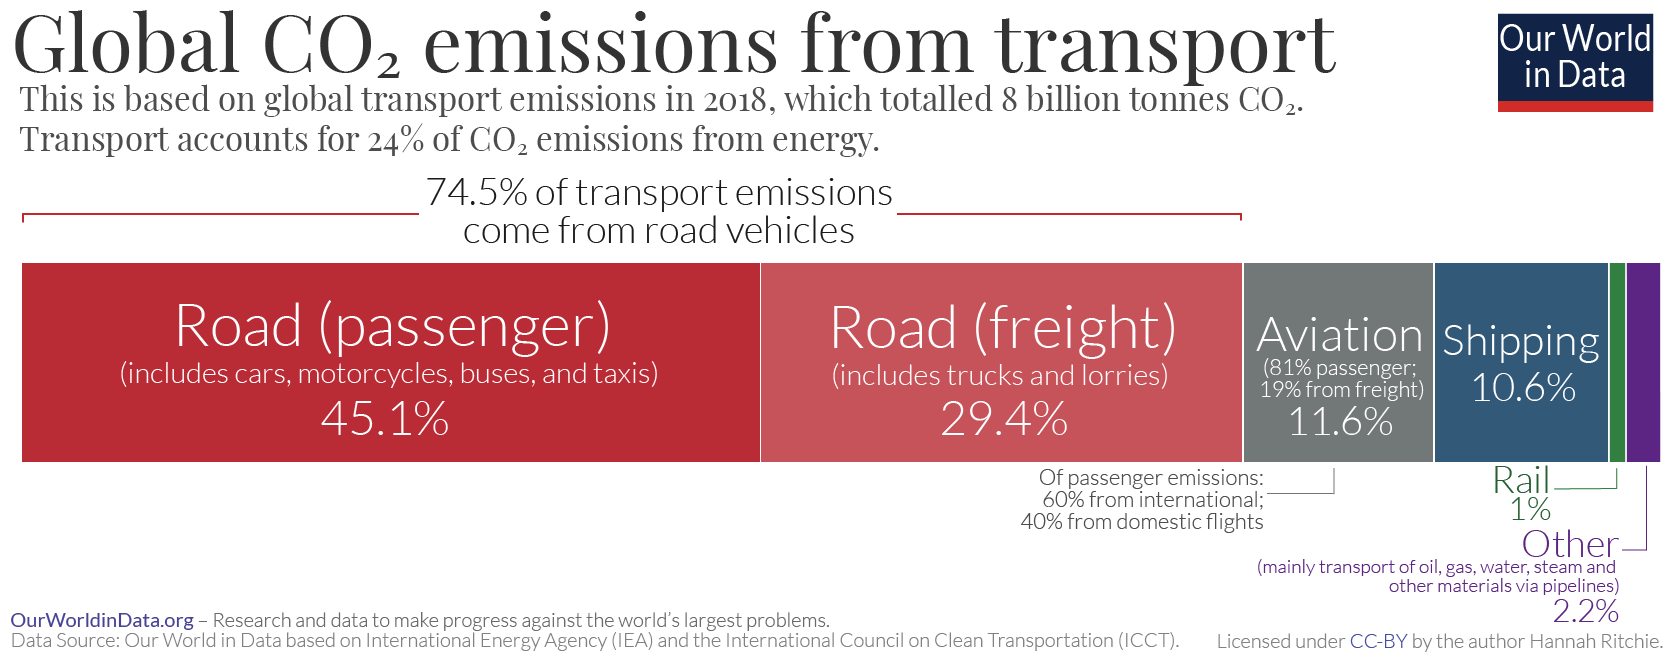
Figure 18 - Global Greenhouse Gas Emissions from Transport (2018, 8GtCO2). Image credit: <OurWorldInData.org>
As shown in Figure 18, the emissions are split about equally between the transport of people and goods. The largest country contributions to Transport emissions were from the United States (21%), China (11%), and India (4%).
Another way to parse the emissions data is shown in Figure 19, which displays the share of total greenhouse gas emissions down to as many as three levels of human activity.
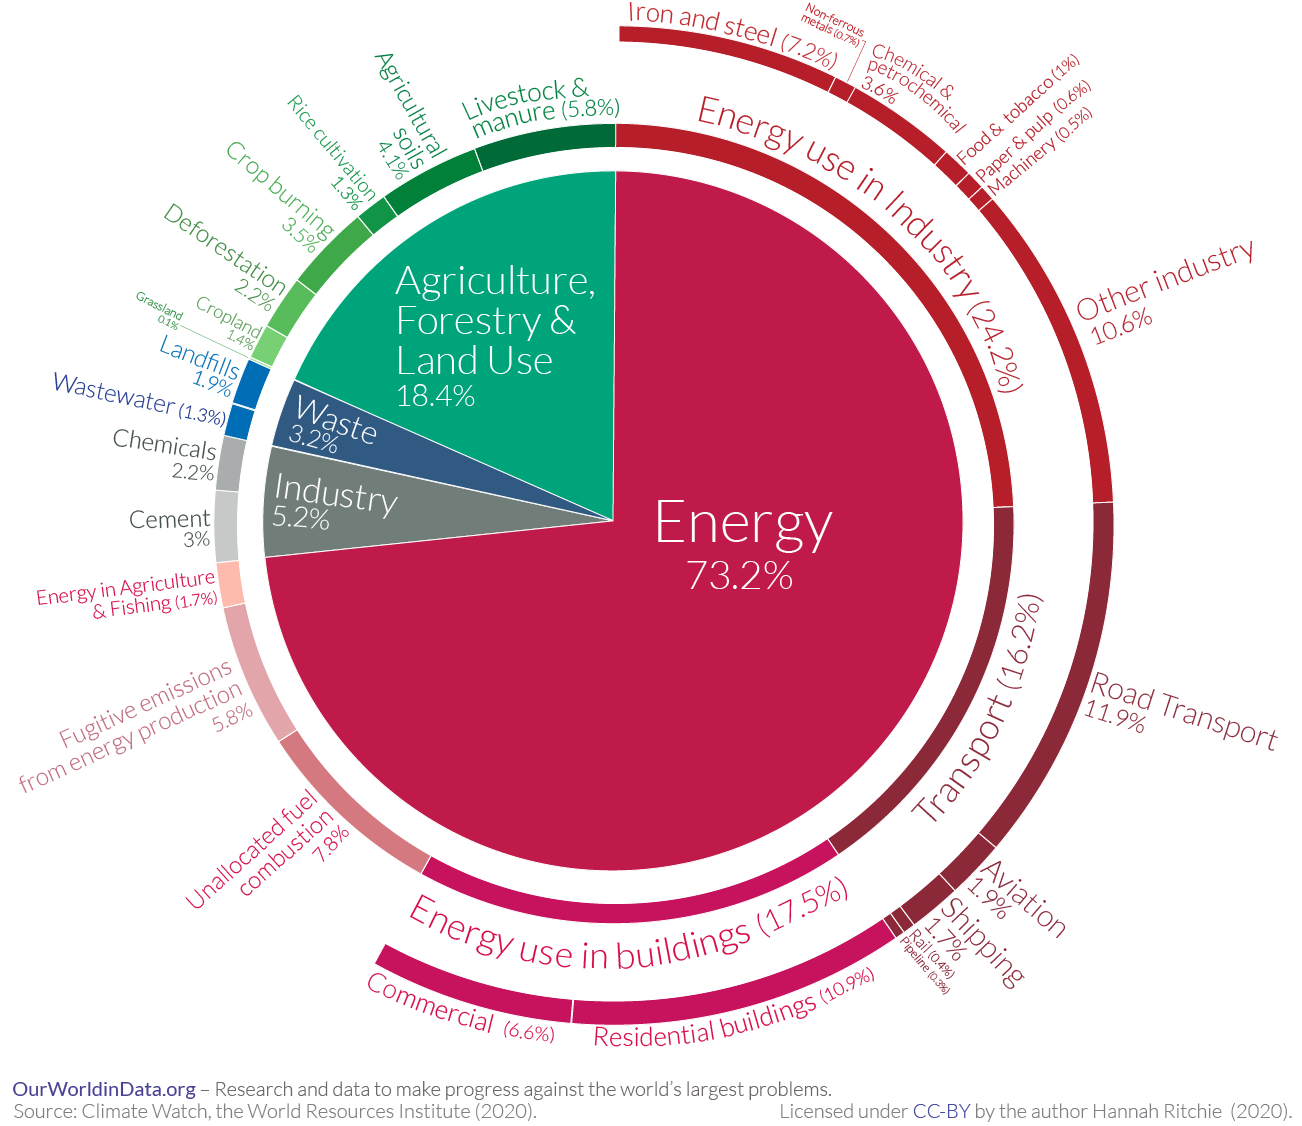
Figure 19 - Global Greenhouse Gas Emissions by Sector (2016, total emissions 49.5 GtCO2e). Image credit: <OurWorldInData>
After the Energy Mega-sector, which includes (amongst others) the Power and Transportation Sectors discussed earlier, the biggest contributing Sector is Agriculture, Forestry, and Land Use, which emits about 18% (9 GtCO2e) of all anthropogenic greenhouse gases, mostly in the form of Methane and Nitrous Oxide. This is not a small sector; the global warming impact of the emissions from Livestock and Manure subsector on its own are greater than those from the third largest Sector, Industry (Cement and Chemicals production).
The picture of anthropogenic greenhouse gas emissions is as complex as the fabric of human activities that cause them. In consequence, data is not always available, or not always consistent between sources; however, in general discrepancies tend stay within the same order of magnitude of the effect and do not take away from the main picture that emerges.
Every additional ton of anthropogenic emissions is one too many and time is of the essence to curb and mitigate the global warming to come.
